
The financial markets are constantly evolving, influenced by economic events, geopolitical developments, and investor sentiment. For traders and investors, understanding market trends and making informed decisions is crucial for success. One of the most widely used tools in this process is technical analysis of the financial markets. This method provides insights into price movements, trends, and market psychology, allowing participants to identify potential opportunities and risks.
In this article, we explore the fundamentals of technical analysis, its key tools and techniques, its advantages and limitations, and how traders use it to navigate complex financial markets.
1:What Is Technical Analysis?
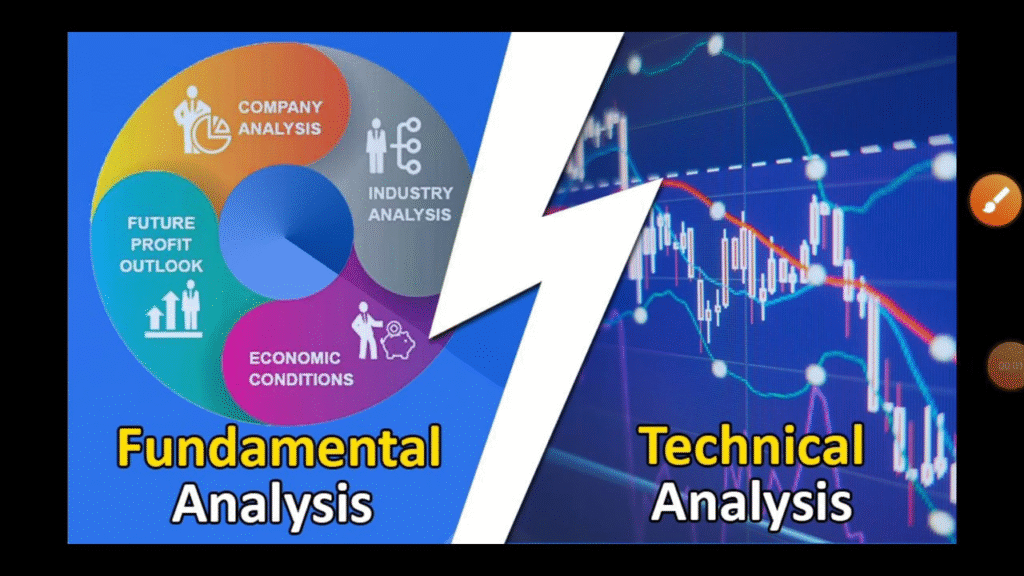
Technical analysis is a method of evaluating financial markets by analyzing historical price data and trading volumes rather than focusing solely on the intrinsic value of an asset. Unlike fundamental analysis, which considers company earnings, economic indicators, and industry trends, technical analysis relies on charts, patterns, and statistical measures to predict future price movements.
The premise of technical analysis is that all available information, including economic and political events, is already reflected in the asset’s price. This approach assumes that prices move in trends and that history tends to repeat itself due to market psychology and investor behavior.
2:Key Principles of Technical Analysis
To effectively use technical analysis of the financial markets, traders follow several core principles:
1. Price Discounts Everything
Technical analysts believe that all information, whether public or private, is already incorporated into market prices. This principle suggests that by studying price charts, traders can gain a comprehensive understanding of market sentiment and potential future movements.
2. Prices Move in Trends
Markets rarely move randomly. Prices tend to follow trends, whether upward, downward, or sideways. Identifying these trends early can help traders position themselves to benefit from market momentum.
3. History Repeats Itself
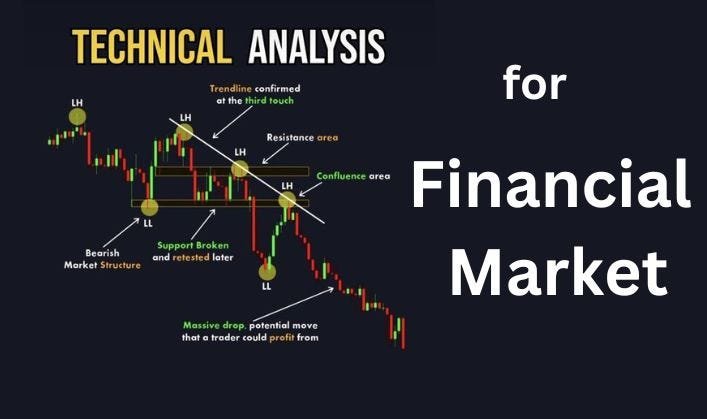
Price patterns often recur because human behavior in the markets tends to repeat. Recognizing these patterns, such as head and shoulders, double tops, or flags, allows traders to anticipate potential price movements based on historical behavior.
3:Tools and Strategies For Effective Market Analysis

Several tools and techniques are integral to technical analysis of the financial markets. These tools help traders visualize trends, assess momentum, and make informed decisions.
1. Chart Types
Charts are the foundation of technical analysis. The most commonly used types include:
- Line Charts: Simple representations connecting closing prices over time.
- Bar Charts: Show open, high, low, and close prices for a given period.
- Candlestick Charts: Provide a visual representation of price movements, helping identify trends and reversal patterns.
2. Trend Lines and Channels
Trend lines connect consecutive highs or lows to indicate the direction of the market. Channels are parallel lines that contain price action, helping traders identify support and resistance levels.
3. Support and Resistance Levels
Support levels indicate where a price tends to stop falling, while resistance levels suggest where it may stop rising. Recognizing these levels helps traders anticipate market reversals or continuation patterns.
4. Technical Indicators
Indicators use mathematical formulas applied to price and volume data to forecast market behavior. Popular indicators include:
- Moving Averages (MA): Identify trends and smooth out price fluctuations.
- Relative Strength Index (RSI): Measures momentum and identifies overbought or oversold conditions.
- MACD (Moving Average Convergence Divergence): Shows trend direction and momentum changes
- Bollinger Bands: Highlight volatility and potential price reversals.
5. Volume Analysis
Volume confirms trends and validates price movements. Increasing volume during an upward trend suggests strong buying interest, while declining volume may indicate weakening momentum.
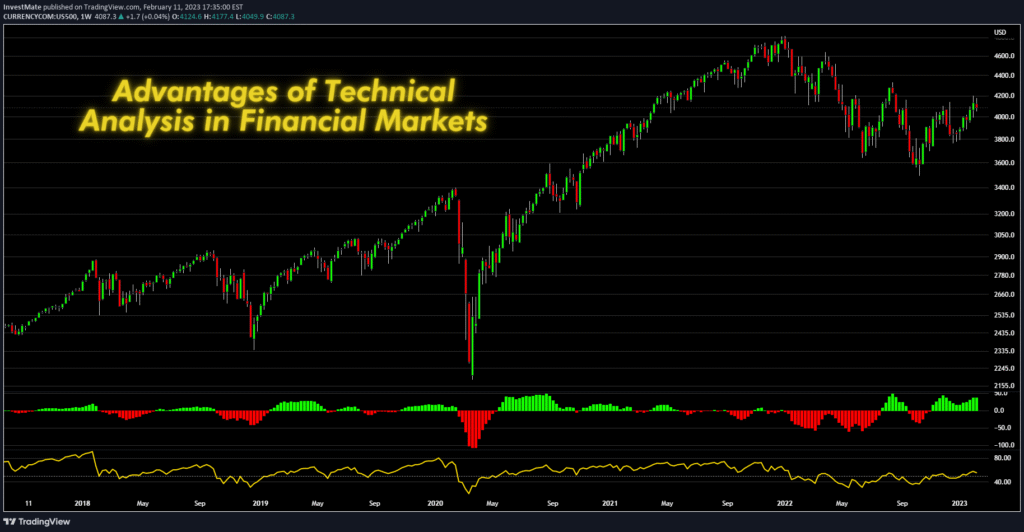
4:Benefits of Technical Analysis
There are several advantages to using technical analysis of the financial markets:
- Timely Decisions: Provides insights for short-term and long-term trades.
- Objective Approach: Uses data-driven methods rather than subjective opinions.
- Identifying Trends: Helps traders enter and exit positions at strategic points.
- Versatility: Applicable across stocks, forex, commodities, and cryptocurrencies.
5:Risks and Shortcomings of Technical Analysis
Despite its advantages and technical analysis is not foolproof and has limitations:
- Not Predictive: It identifies probabilities, not certainties.
- Market Volatility: Sudden news or events can invalidate patterns.
- Requires Skill and Experience: Effective analysis demands understanding of charts, indicators, and patterns.
- Over reliance on Historical Data: Past price action may not always reflect future movements.
6:Integrating Technical and Fundamental Analysis
While technical analysis focuses on price trends and patterns, combining it with fundamental analysis can enhance decision-making. For instance, understanding a company’s earnings report alongside chart patterns can provide a more complete market perspective. Many professional traders adopt a hybrid approach to balance the insights of both methods.
7:Popular Strategies Using Technical Analysis
Several trading strategies rely heavily on technical analysis of the financial markets:
- Trend Following: Traders identify and follow market trends to maximize profits.
- Swing Trading: Focuses on capturing short- to medium-term price swings.
- Day Trading: Relies on intraday price movements for quick profits.
- Breakout Trading: Traders enter positions when prices break through key support or resistance levels.
- Mean Reversion: Assumes prices will revert to their average after extreme movements.
8:How Investor Behavior Affects Market Trends
Market psychology plays a crucial role in technical analysis. Fear and greed drive market behavior, causing repetitive patterns that technical analysts study. By understanding sentiment, traders can anticipate reactions to key levels, breakouts, and reversals.
Indicators like the RSI or Bollinger Bands indirectly measure market psychology, highlighting when investors may be overly optimistic or pessimistic.
9:Expert Tips for Market Analysis

- Start with a Clear Plan: Define goals, risk tolerance, and preferred strategies.
- Use Multiple Indicators: Confirm signals with more than one tool for accuracy.
- Focus on Trends: Avoid trading against dominant market trends unless there is a strong signal.
- Keep a Trading Journal: Record trades, outcomes, and lessons learned for continuous improvement.
- Stay Updated: Market conditions can change rapidly; staying informed is crucial.
Wrap up
Technical analysis of the financial markets is a vital tool for traders and investors seeking to make informed decisions based on price trends, patterns, and market psychology. By using charts, indicators, and trend analysis, participants can identify potential opportunities and manage risks effectively. While not without limitations, when combined with fundamental insights, technical analysis provides a robust framework for navigating stocks, forex, commodities, and other financial instruments. Understanding patterns, applying strategies carefully, and remaining disciplined are keys to leveraging technical analysis successfully.
Expert Answers to Market Analysis Questions
1. What is the main purpose of technical analysis?
It is used to forecast future price movements based on historical data, trends, and market patterns.
2. Can technical analysis be used in all financial markets?
Yes. it is applicable across stocks, forex, commodities, and cryptocurrencies.
3. How many indicators should I use for analysis?
Using multiple indicators for confirmation is recommended but avoid overloading with too many conflicting signals.
4. Is technical analysis foolproof?
No. it provides probabilities not guarantees. Market volatility and unexpected events can affect outcomes.
5. Should I combine technical and fundamental analysis?
Yes. integrating both approaches often provides a more complete understanding of market conditions and potential opportunities.